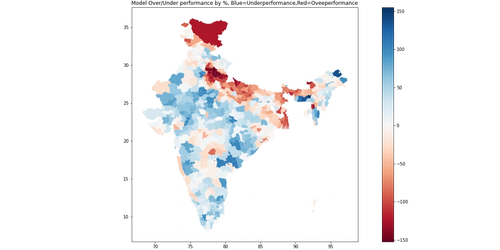
This project joins census-style demographic signals with district-level election results. The original analysis compared predicted alliance behavior with actual 2019 results, then mapped where alliances over- or under-performed relative to demographics.
The interesting part is not just the model score. It is the geography: where patterns cluster, where third parties distort a two-alliance view, and where demographic signals fail to explain local political behavior.
The model was a compact k-nearest-neighbors approach over demographic fields. The output became more useful once it was visual: predicted alliance behavior, spatial residuals, and the local exceptions that make the story less tidy.